CUET Preparation Today
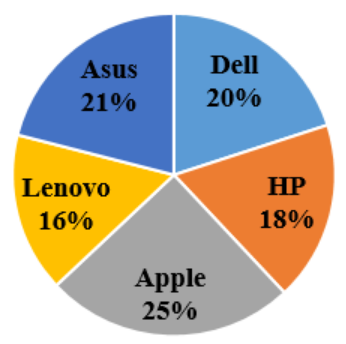
The following pie chart shows the percentage-wise distribution of the nominal sales figures of laptops of five different companies during a given period.
If the total sales of all the companies taken together is ₹55,00,000, then find the difference between the sales of HP and Apple. |
₹3,65,000 ₹7,50,000 ₹4,25,000 ₹3,85,000 |
₹3,85,000 |
Difference in number of laptops of HP and Apple = \(\frac{25-18 }{100}\) × 5500000 = \(\frac{7 }{100}\) × 5500000 = 385000 |