CUET Preparation Today
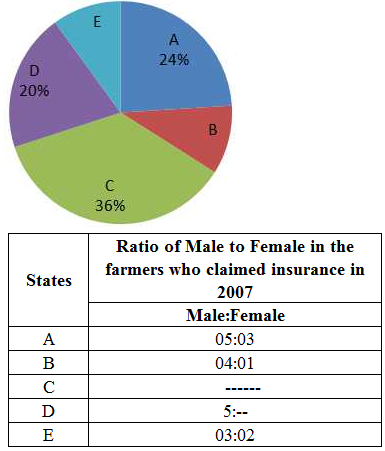
The following pie-chart and table show the percentage distribution of farmers in 5 states A, B, C, D & E of a country who claimed insurance due to drought in the year 2017 and ratio of males to females of the number of farmers in states, respectively. Study the pie-chart and the table carefully and answer the following questions. Note: Some data are missing in the pie-chart and table, if required in any question, find the missing data first and then answer the question. Total number of farmers who claimed insurance in the year 2017 = 2,64,000
The number of farmers who claimed insurance in state C exceeds the total number of farmers (who claimed insurance)in state E and state A together by 5280. What is the percentage of farmers who claimed insurance in state E? |
10% 25% 40% 15% |
10% |