CUET Preparation Today
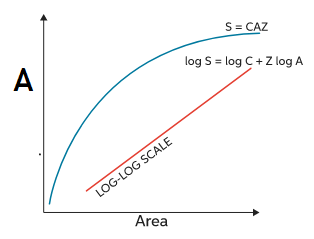
German naturalist and geographer Alexander von Humboldt proposed graph given below .Identify A in the graph ?
|
Frugivorous (fruit-eating) birds. Biomass. Extinction. Species richness. |
Species richness. |
The correct answer is Option (4)- Species richness. German naturalist and geographer Alexander von Humboldt observed that within a region species richness increased with increasing explored area, but only up to a limit. In fact, the relation between species richness and area for a wide variety of taxa (angiosperm plants, birds, bats, freshwater fishes) turns out to be a rectangular hyperbola . On a logarithmic scale, the relationship is a straight line described by the equation log S = log C + Z log A where, S= Species richness A= Area Z = slope of the line (regression coefficient) C = Y-intercept.
|