CUET Preparation Today
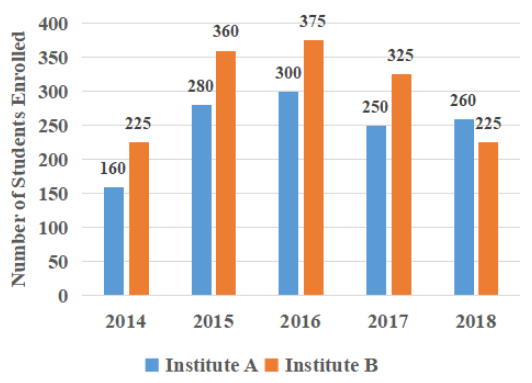
Bar graph shows the number of students enrolled for a vocational course in institutes A and B during 5 years from 2014 to 2018.
The total number of students enrolled in institute B during 2014, 2016 and 2018 is what percent of the total number of students enrolled in institute A during the five Years? |
66% 49% 57% 75% |
66% |
Number of students enrolled in B in 2014, 2016 and 2018 = 225 + 375 + 225 = 825 Total students enrolled in A = 160 + 280 + 300 + 250 + 260 = 1250 Required percentage = \(\frac{825}{1250}\) × 100 = 66% |