CUET Preparation Today
CUET
General Aptitude Test
Quantitative Reasoning
Data Interpretation & Stats
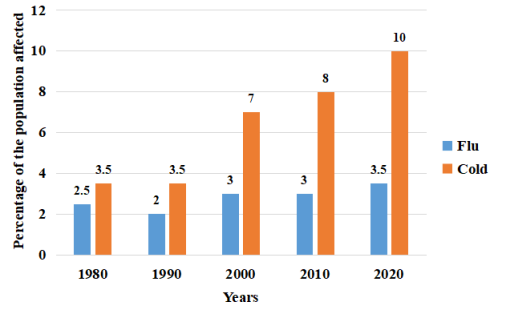
Study the given graph and answer the following question.
As per data available above in which of the given years was the percentage of the population affected by cold the minimum?
1980
1990
2010
2000