CUET Preparation Today
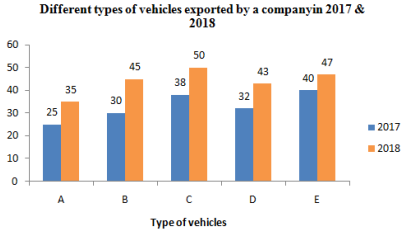
The given Bar Graph presents the number of different types of vehicles exported by a company in 2017 and 2018.
The increase in the exports in 2018 as compared to that in 2017 is closest to 32 % in case of vehicles of type: |
B A C D |
C |
Increase in the exports in 2018 as compared to that in 2017 for A = \(\frac{35-25 }{25}\) × 100 = 40% Increase in the exports in 2018 as compared to that in 2017 for B = \(\frac{45-30 }{30}\) × 100 = 16.67% Increase in the exports in 2018 as compared to that in 2017 for C = \(\frac{50-38 }{38}\) × 100 = 31.57% which is approx equals to 32%. Increase in the exports in 2018 as compared to that in 2017 for D = \(\frac{43-32 }{32}\) × 100 = 34.37% Increase in the exports in 2018 as compared to that in 2017 for E = \(\frac{47-40 }{40}\) × 100 = 17.5% Ans :- C |