CUET Preparation Today
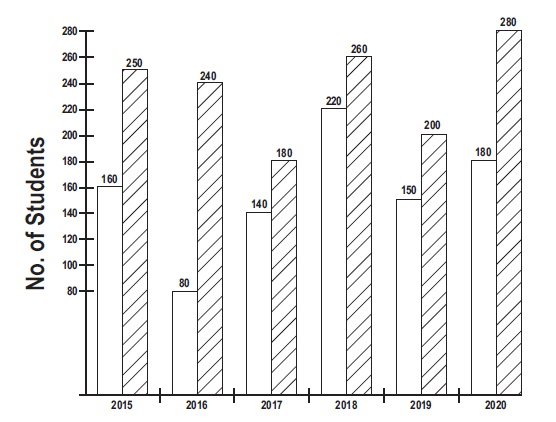
The following bar chart shows the no. of college students enrolled in two summer camps A and B from 2015 to 2020. Blank Bars = A Line Bars = B
What is the ratio of students enrolled in camp A in the years 2015, 2017 and 2018 to the students enrolled in camp B in the years 2016, 2019 and 2020? |
13 : 18 15 : 17 16 : 15 18 : 13 |
13 : 18 |
No. of students in camp A in 2015, 2017 and 2018 = 160 + 140 + 220 = 520 No. of students in camp B in 2016, 2019 and 2020 = 240 + 200 + 280 = 720 Ratio → A : B → 520 : 720 → 13 : 18 |