CUET Preparation Today
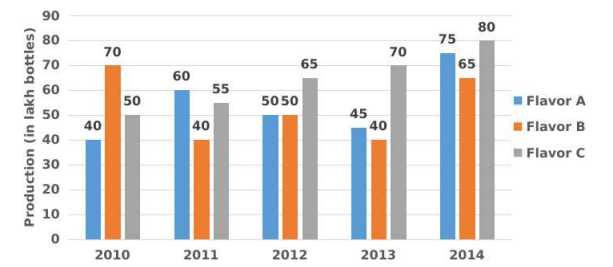
A soft drink company prepares drinks of three different flavours — A, B and C. The production of the three flavours over a period of five years from 2010 to 2014 has been expressed in the given bar graph. Study the graph and answer the question that follows. Production of three different flavours A, B and (in lakh bottles) by a company over five years.
What was the approximate percentage decline in the production of flavour A in 2013 as compared to the production of flavour A in 2011? |
30% 24% 20% 25% |
25% |
Production of flavour A in 2013 = 45 Production of flavour A in 2011 = 60 Percentage decline in production of A in 2013 as compared to 2011 = \(\frac{60-45}{60}\) × 100 = \(\frac{15 }{60}\) × 100 = 25% |