CUET Preparation Today
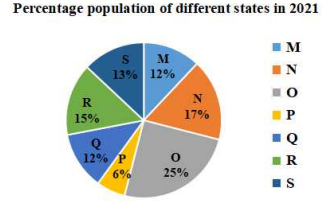
The following pie chart shows the percentage population of different states in the year 1021. The total population of the given states is 4879000.
The following table shows the sex wise population ratio of different states:
Study the above data and answer the following question: What is the ratio of number of females in state P to the number of females in state S? |
2 : 7 3 : 5 6 : 11 6 : 13 |
6 : 13 |
Population in state P = \(\frac{6 }{100}\) × 4879000 = 292740 Ratio of male to female in P = 4 : 5 9R = 292740 1R = \(\frac{292740 }{9}\) = Number of females in P = \(\frac{292740 }{9}\) × 5 Population of state S = \(\frac{13 }{100}\) × 4879000 = 634270 Ratio of male to female in S = 4 : 5 Number of females in S = \(\frac{634270 }{9}\) × 5 Ratio of female of State P and S = \(\frac{292740 }{9}\) × 5 : \(\frac{634270 }{9}\) × 5 = 6 : 13
|