CUET Preparation Today
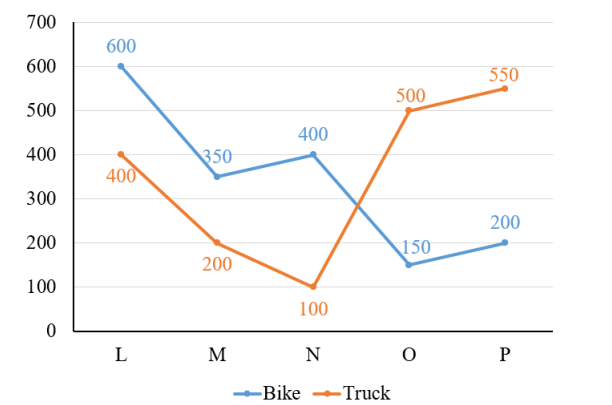
The line chart given below shows the production of bike and truck by five companies L, M, N, O and P.
Which of the following statement is correct? I. The ratio of production of bike to the production of truck by company M are 7 : 4. II. The difference between average of production of bike and truck by all companies is 10. |
Neither I nor IT Only II Only I Both I and II |
Both I and II |
I. The ratio of production of bike to the production of truck by company M are 7 : 4. Production of Bike by M : Production of truck by M 350 : 200 7 : 4 Statement I is correct . II. The difference between average of production of bike and truck by all companies is 10. Average production of Bike = \(\frac{600 + 350 + 400 + 150 + 200 }{5}\) = \(\frac{ 1700 }{5}\) = 340 Average production of Truck = \(\frac{400 + 200 + 100 + 500 + 550 }{5}\) = \(\frac{ 1750 }{5}\) = 350 Difference = 350 - 340 = 10 Statement II is correct. Ans :-Both I and II |