CUET Preparation Today
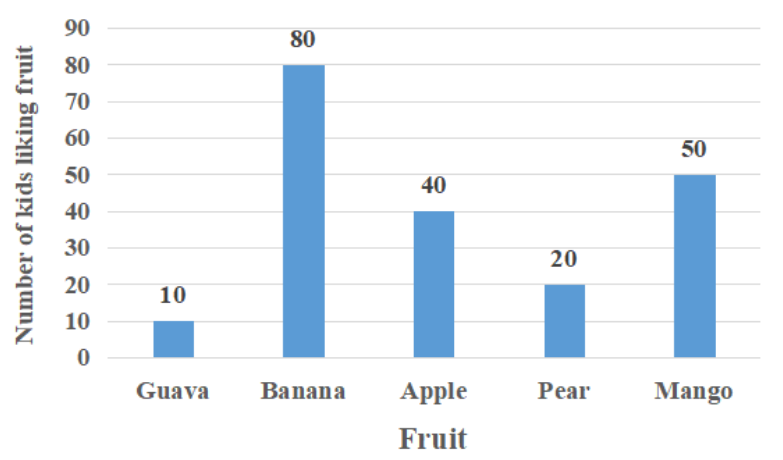
The following bar graph shows the number of kids who like different fruits.
What percentage of kids like bananas or apples? |
40 50 30 60 |
60 |
Total number of kids = 10 + 80 + 40 + 20 + 50 = 200 Number of kids like bananas or apple = 80 + 40 = 120 Percentage of kids like Bananas or apple = \(\frac{120 }{200}\) × 100 = 60% |