CUET Preparation Today
CUET
General Aptitude Test
Quantitative Reasoning
Data Interpretation & Stats
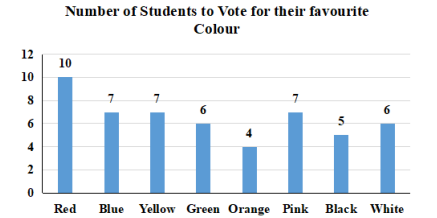
As per the data on the basis of which the following bar graph has been constructed, how many students were surveyed?
53
51
52
50
Number of students surveyed = 10 + 7 + 7 + 6 + 4 + 7 + 5 + 6 = 52