CUET Preparation Today
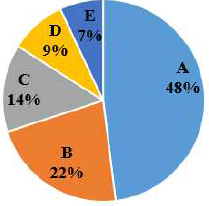
The given pie chart represents the distribution of the percentage of sales of a particular brand of bike from five showrooms. A, B, C, D and E, during 2021. The total number of bikes sold during that year from the five showrooms is 6000.
What is the total number of bikes sold from showrooms C and D? |
1550 1280 1380 1640 |
1380 |
Total number of bikes sold from C & D = \(\frac{14+9 }{100}\) × 6000 = 1380 |