CUET Preparation Today
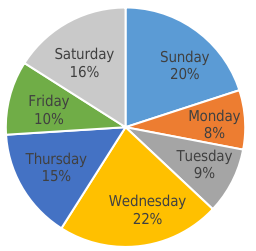
Study the given pie-chart and answer the question that follows. The chart represents the percentage-wise distribution of total number of vanilla cakes and chocolate cakes sold every day in a week. Total number of cakes sold in a week = 10500.
The ratio of vanilla cakes sold to chocolate cakes sold on Friday is 4 : 3. If the selling price of one vanilla cakes is ₹9 and selling price of one chocolate cake is ₹10 , then the total amount earned (in ₹) by selling all the vanilla cakes and chocolate cakes on Friday is : |
11,000 8,900 10,000 9,900 |
9,900 |
Total cake sold on Friday = \(\frac{1}{10}\) × 10500 = 1050 ratio of vanilla cakes sold to chocolate cakes sold on Friday = 4 : 3 7R = 1050 1R = 150 Number of vanilla cake = 4R = 600 , Number of chocolate cake = 3R = 450 Total earned amount = 600 × 9 + 450 × 10 = 5400 + 4500 = 9900 |