CUET Preparation Today
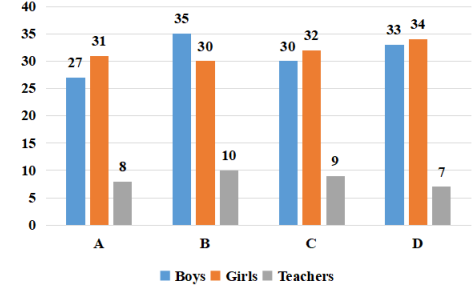
The given bar-graph shows the number of boys and girls in classes A, B, C and D in a school, and the number of teachers allotted to each class.
Which class has the least percentage of girls? |
B D C A |
B |
In class A , Total strength = 27 + 31 + 8 = 66 Number of girls = 31 Percentage of girls = \(\frac{31 }{66}\) × 100 = 46.96% In class B , Total strength = 35 + 30 + 10 = 75 Number of girls = 30 Percentage of girls = \(\frac{30 }{75}\) × 100 = 40% In class C , Total strength = 30 + 32 + 9 = 71 Number of girls = 32 Percentage of girls = \(\frac{32 }{71}\) × 100 = 45.07% In class D , Total strength = 33 + 34 + 7 = 74 Number of girls = 34 Percentage of girls = \(\frac{34 }{74}\) × 100 = 50% So , Class B has least percentage of girls. |