CUET Preparation Today
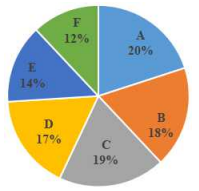
The given pie chart represents the percentage-wise distribution of 300 students of class X in a school in six different sections A, B, C, D, E and F.
The given table shows the number of boys of class X in six different sections A, B, C, D, E and F.
If in section E, the ratio of boys and girls is 4 : 3. then the ratio of the number of girls in section B to that of the number of girls in section E is: |
15 : 8 13 : 8 13 : 9 14 : 9 |
14 : 9 |
Total number of students in E = \(\frac{14 }{100}\) × 300 = 43 Ratio of boys to girls in E = 4 : 3 ATQ , 7R = 42 1R = 6 Number of girls = 3R = 18 Total number of students in B = \(\frac{18 }{100}\) × 300 = 54 Number of boys in B = 26 So , Number of girls = 54 - 26 = 28 Ratio of number of girls in B to number of girls in E = 28 : 18 = 14 : 9 |