CUET Preparation Today
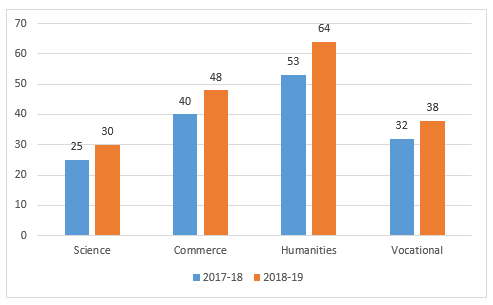
The given bar graph represents the number of students who appeared in the board examinations in session 2017-18 and 2018-19. Study the graph and answer the question that follows.
The difference between the average number of students of Science and Humanities streams in 2017-2018 and that in Commerce and Vocational in 2018-19, is: |
8 6 4 2 |
4 |
Average number of students of Science and Humanities streams in 2017-2018 = \(\frac{25+53 }{2 }\) = \(\frac{78 }{2 }\) = 39 Average number of students of Commerce and Vocational in 2018-19 = \(\frac{48+38 }{2 }\) = \(\frac{86 }{2 }\) = 43 Difference between the average number of students of Science and Humanities streams in 2017-2018 and that in Commerce and Vocational in 2018-19 = 43 - 39 = 4 |