CUET Preparation Today
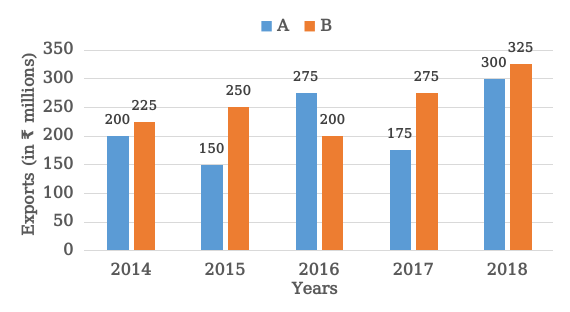
Study the given bar graph and answer the question that follows. The bar graph shows the exports of cars of type A and B (in ₹ millions) from 2014 to 2018.
What is the ratio of the total exports of cars of type A in 2016 and 2018 to the total exports of cars of type B in 2014 and 2017 ? |
10 : 9 11 : 10 25 : 16 23 : 20 |
23 : 20 |
Export of car A in 2016 & 2018 : Export of car B in 2014 & 2017 (275+300) : ( 225+275) 575 : 500 23 : 20 |