CUET Preparation Today
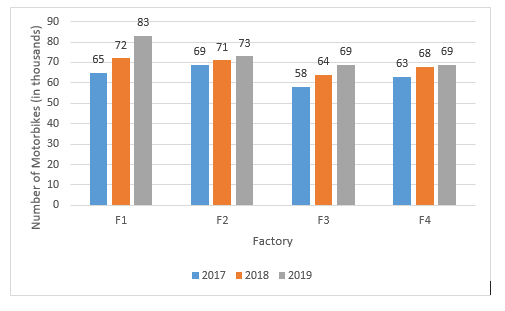
The following bar graph shows the sales ( in thousands) of motor bikes by the factories, F1, F2, F3 and F4 in 2017, 2018 and 2019.
Which factory had the least number of sales across all the years? |
F2 F3 F1 F4 |
F3 |
Total sale of F1 = 65 + 72 + 83 = 220 Total sale of F2 = 69 + 71 + 73 = 213 Total sale of F3 = 58 + 64 + 69 = 191 Total sale of F4 = 63 + 68 + 69 = 200 So , Total sale of F3 is least. |