CUET Preparation Today
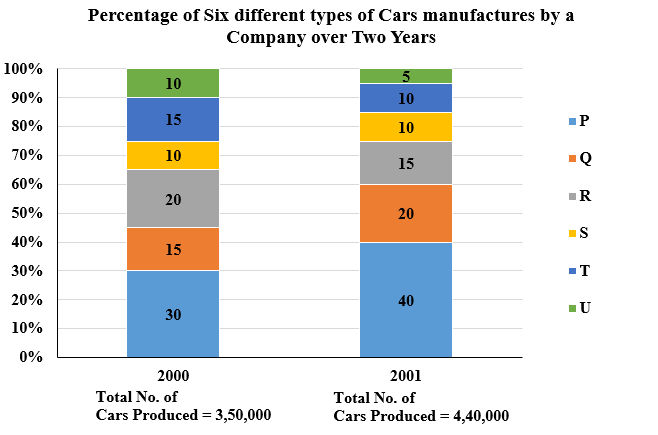
The bar graph given below shows the percentage distribution of the total production of six different types of cars by a car manufacturing company over 2 years.
If 75% of the T type cars produced in each year were sold by the company, how many T type cars remain unsold ? |
23500 22000 24125 25000 |
24125 |