CUET Preparation Today
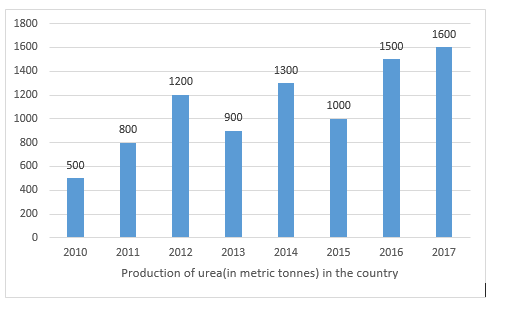
Study the given chart carefully and answer the question accordingly.
In which of the following years was the percentage increase in production from the previous year, the maximum among the given years? |
2014 2016 2011 2012 |
2011 |
Lets solve one by one for each option. 1. 2014 Production in 2014 = 1300 Production in 2013 = 900 Increase in production in 2014 from its previous year = \(\frac{1300-900}{900}\) × 100 = \(\frac{400}{900}\) × 100 = 44.44% 2. 2016 Production in 2016 = 1500 Production in 2015 = 1000 Increase in production in 2016 from its previous year = \(\frac{1500-1000}{1000}\) × 100 = \(\frac{500}{1000}\) × 100 = 50% 3. 2011 Production in 2011 = 800 Production in 2010 = 500 Increase in production in 2011 from its previous year = \(\frac{800-500}{500}\) × 100 = \(\frac{300}{500}\) × 100 = 60% 4. 2012 Production in 2012 = 1200 Production in 2011 = 800 Increase in production in 2012 from its previous year = \(\frac{1200-800}{800}\) × 100 = \(\frac{400}{800}\) × 100 = 50% Increase percentage comparative to previous year is maximum in 2011.
|