CUET Preparation Today
Study the given graph and answer the question that follows.
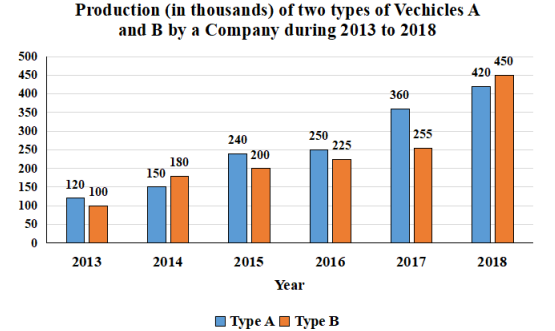
By what percentage (approximately)is the average number of vehicles of type B produced in 2014, 2016 and 2018 less than the number of vehicles of type A produced in 2017? |
21.4 18.6 20.8 23.6 |
20.8 |
Average number of vehicles of type B produced in 2014, 2016 and 2018 = \(\frac{180+225+450}{3}\) = \(\frac{ 855}{3}\) = 285 Number of vehicles of type A produced in 2017 = 360 Required percentage = \(\frac{360 - 285 }{360}\) × 100 = \(\frac{ 75 }{360}\) × 100 = 20.8% |