CUET Preparation Today
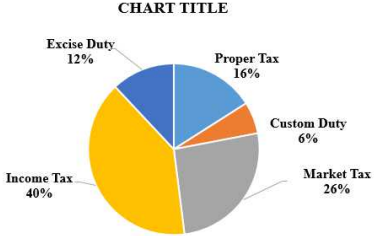
The following pie chart shows the distribution of income from different taxes. Study the chart and answer the question.
If the income from the market tax in a year is ₹260 crore, then the total income from other sources is: (in ₹ crore) |
540 560 740 760 |
740 |
Market tax = 260 crores 26% of toal income = 260 crores 1% of total income = 10 crores Total income from other sources = ( 100 - 26 )% = 74% of total income = 74 × 10 = 740 crores |