CUET Preparation Today
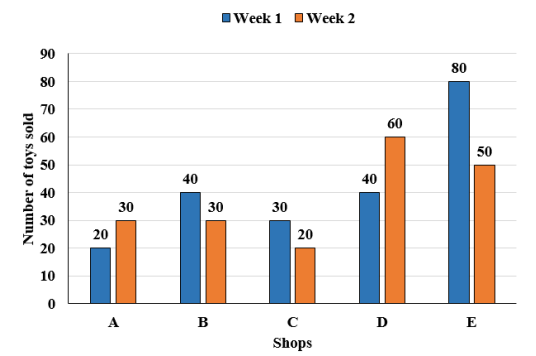
The below bar graph shows the number of toys sold by five different shops(i.e., A, B, C, D and E) in the first week and second week.
Find the ratio of the total number of toys sold by shops A, B and C in the first week to the number of toys sold by shops C, D and E in the second week. |
1 : 13 9 : 1 13 : 9 9 : 13 |
9 : 13 |
Total toys sold by A , B & C in week 1 : Total toys sold by C , D & E in week 2 ( 20 + 40 + 30 ) : ( 20 + 60 + 50 ) 90 : 130 9 : 13 |