CUET Preparation Today
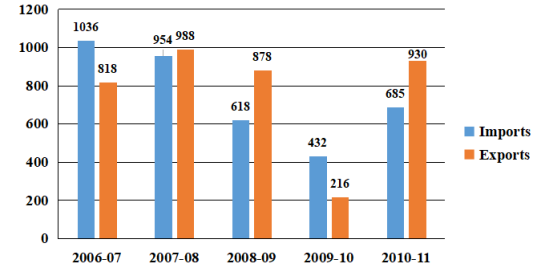
Study the following graph which shows imports and exports (in ₹ crores) of a company during 2006-07 to 2010-11 and answer the question.
In which of the following years was (Imports-Exports) minimum? |
2010-11 2009-10 2008-09 2006-07 |
2009-10 |
Lets find out one by one for each option , 1. 2010 - 11 (Imports-Exports) = 930 - 685 = 245 2. 2009 - 10 (Imports-Exports) = 432 - 216 = 216 3. 2008 - 09 (Imports-Exports) = 878 - 618 = 260 4. 2006 - 07 (Imports-Exports) = 1036 - 818 = 218 So , (Imports-Exports) is minimum for year 2009 - 10 i.e. 216 |