CUET Preparation Today
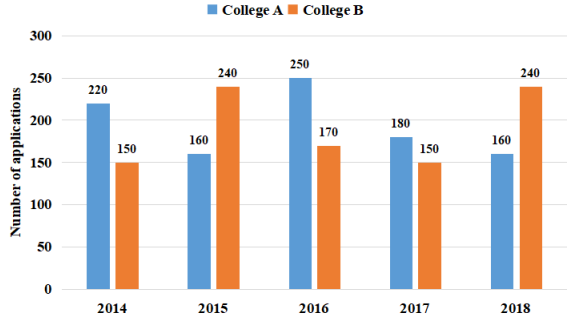
Study the following bar graph and answer the question given below. The bar graph represents the total number of applications received for B.Sc. Mathematics by two different colleges A and B in 5 different years.
Find the difference between the average number of applications received by college A from 2014 to 2018 and the average number of applications received by college B from 2014 to 2018? |
5 4 6 8 |
4 |
Average number of applications received by college A from 2014 to 2018 = ( \(\frac{220+160+250+180+160 }{5}\) ) = ( \(\frac{970 }{5}\) ) = 194 Average number of applications received by college B from 2014 to 2018 = ( \(\frac{150+240+170+150+240 }{5}\) ) = ( \(\frac{ 950 }{5}\) ) = 190 Difference b/w average number of applications received by A and B from 2014 to 2018 = 194 - 190 = 4
|