CUET Preparation Today
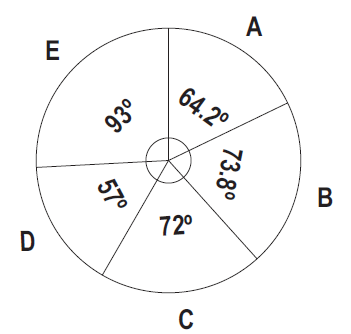
Study the given graph and answer the questions that follows. Degree wise distribution of no. of students working in Class (A, B, C, D and E): Total no. of students = 3000
If 40% of the students in Class E are transferred to Class A, then the difference between the no. of students in A and no. of students in C is: |
145 175 225 245 |
245 |
⇒ No. of students in class E = \(\frac{93}{360}\) × 3000 = 775 ⇒ 40% of E = \(\frac{2}{5}\) × 775 = 310 ⇒ No. of students in class A = \(\frac{64.2}{360}\) × 3000 = 535 ⇒ No. of students in class A after adding 40% of E = 535 + 310 = 845 ⇒ No. of students in class C = \(\frac{72}{360}\) × 3000 = 600 Hence, The difference = 845 - 600 = 245 |