CUET Preparation Today
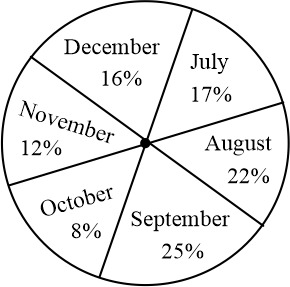
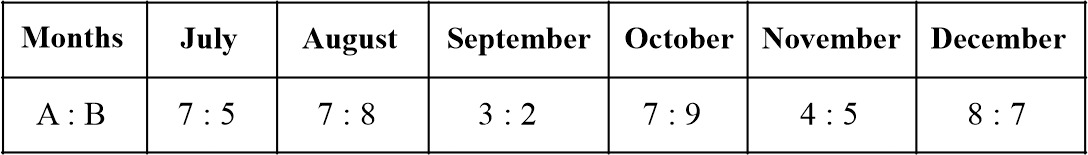
The following pie chart and table shows the percentage wise distribution of Computers, say brand A and brand B by six shops during six-months July - December in the year 2022. Total Number of Computers = 2400
Find the ratio of number of computers sold by A in the month of August to the number of computers sold in the month of December. |
64 : 77 77 : 64 88 : 74 74 : 88 |
77 : 64 |
Total sale by A in august = (22% of 2400) × \(\frac{7}{15}\) and sale by A in december = (16% of 2400) × \(\frac{8}{15}\) Required ratio = 22% × 2400 × \(\frac{7}{15}\) : 16% × 2400 × \(\frac{8}{15}\) = (22 × 7) : (16 × 8) = 77 : 64 Alternate: Total number of Computers sold in August is 22% 100% = 2400 22% = 22% × 2400 = 528 Ratio of brand A and brand B computers in August is 7 : 8 15 Units = 528 Brand A (7 Units) = \(\frac{528}{15}\) × 7
Total number of Computers sold in December is 16% 100% = 2400 16% = 16% × 2400 = 384 Ratio of brand A and brand B computers in December is 8 : 7 15 Units = 384 Brand A (8 Units) = \(\frac{384}{15}\) × 8 Required ratio = \(\frac{528}{15}\) × 7 : \(\frac{384}{15}\) × 8 = 77 : 64 |