CUET Preparation Today
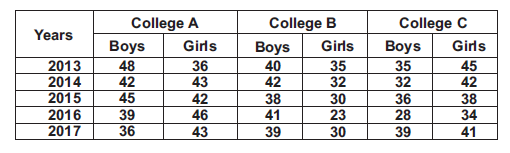
The data given in table shows the no. of boys and girls enrolled 3 different colleges in 5 years.
What is the ratio of no. of Girls in year 2015 to total no. of Boys in year 2016? |
37 : 39 55 : 54 47 : 41 54 : 55 |
55 : 54 |
2015 (Girls) : 2016 (Boys) (42 + 30 + 38) : (39 + 41 + 28) 110 : 108 55 : 54 |