CUET Preparation Today
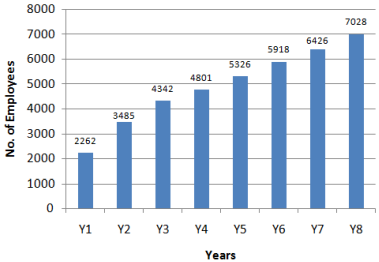
The Bar graph shown below presents the number of employees in an office during eight consecutive years.
What is the growth percentage in the number of employees from Y5 to Y6? |
10.00 11.96 11.11 12.04 |
11.11 |
⇒ Growth percentage in the number of employees from Y5 to Y6 = \(\frac{5918-5326 }{5326}\) × 100 = \(\frac{ 592 }{5326}\) × 100 = 11.11% |