CUET Preparation Today
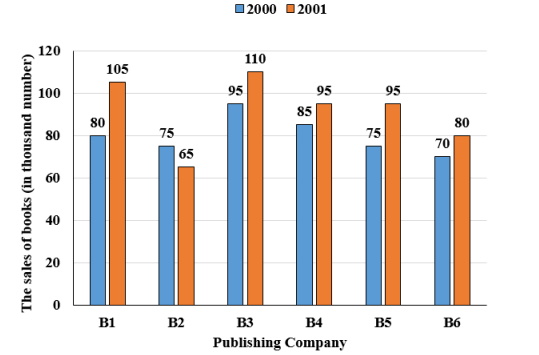
The bar graph given below shows the sales of books (in thousand number) from six branches - B1, B2, B3, B4 , B5 and B6 of a publishing company during two consecutive years 2000 and 2001. Find the percentage (approximate) of the average sales of branches B2, B4 and B6 in the year 2001 to the average sales of branches B1, B3 and B5 in the year 2001.
|
97.95% 82.26% 77.42% 92% |
77.42% |
Average sale of B2, B4 and B6 in the year 2001 = 65 + 95 + 80 = 240 = \(\frac{ 65 + 95 + 80 }{3}\) = \(\frac{240}{3}\) Average sales of branches B1, B3 and B5 in the year 2001 = \(\frac{ 105 + 110 + 95}{3}\) = \(\frac{310}{3}\) Required percentage = \(\frac{240}{310}\) × 100 = 77.42% |