CUET Preparation Today
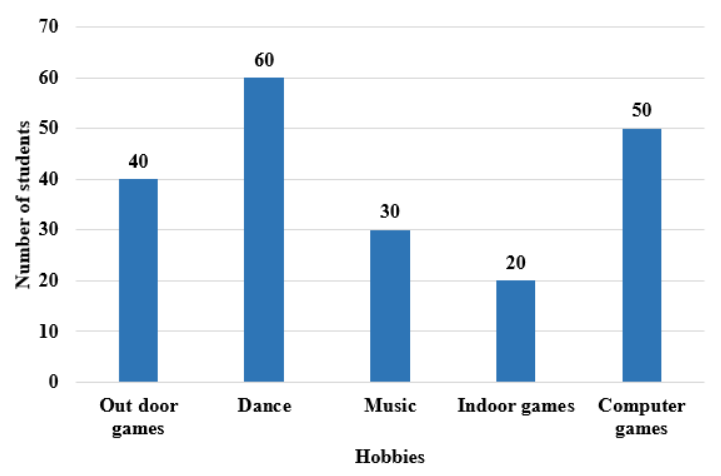
The following bar graph shows the results of a survey conducted for 200 students about their favourite hobbies.
In percentage terms, how many more students chose outdoor games as their favourite hobby over those who chose indoor games as their favourite hobby? |
50% 100% 200% 20% |
100% |
Number of students choose outdoor games = 40 Number of students choose indoor games = 20 Required percentage = \(\frac{40 - 20}{20}\) × 100 = \(\frac{20}{20}\) × 100 = 100% |