CUET Preparation Today
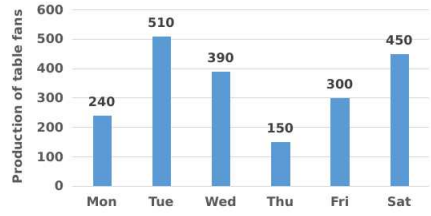
The given bar graph shows the production of table fans in a factory during one week. Study the bar graph and answer the question that follows.
The average production of table fans from Monday to Wednesday is approximately what percentage more than the average production of table fans from Thursday to Saturday? (correct to one decimal place) |
25% 28% 27.5% 26.7% |
26.7% |
Average production of table fans from Monday to Wednesday = \(\frac{240+510+390}{3}\) = \(\frac{ 1140}{3}\) = 380 Average production of table fans from Thursday to Saturday = \(\frac{ 150 + 300 + 450 }{3}\) = \(\frac{ 900}{3}\) = 300 Required percentage = \(\frac{380 - 300 }{300}\) × 100 = \(\frac{80 }{300}\) × 100 = 26.7% |