CUET Preparation Today
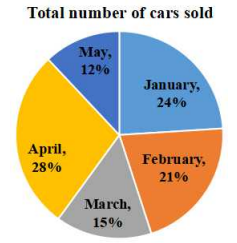
The pie chart below shows total number of cars sold by a company during five months. Total number of cars sold in these 5 months is 5400. Total number of cars sold in January and April is how many more than the number of cars sold in May?
|
2258 2160 2200 2100 |
2160 |
Difference in car sold in January & April to May = \(\frac{(24+28) - 12}{100}\) × 5400 = \(\frac{40}{100}\) × 5400 = 2160 |