CUET Preparation Today
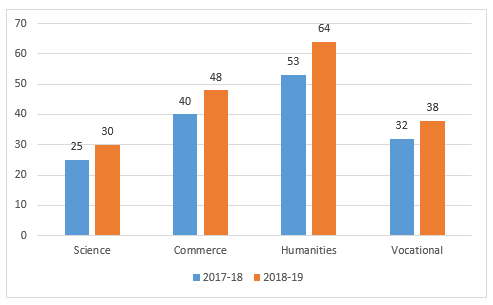
The given bar graph represents the number of students who appeared in the board examinations in session 2017-18 and 2018-19. Study the graph and answer the question that follows.
What percentage is the total number of students who appeared in 2017-18 is less than the total number of students who appeared in 2018-19? (Correct to one decimal place) |
15% 20.5% 12% 16.7% |
16.7% |
Total number of students appeared in examinations in 2017-18 = 25 + 40 + 53 + 32 = 150 Total number of students appeared in examinations in 2018-19 = 30 + 48 + 64 + 38 = 180 Required percentage = \(\frac{180-150}{180 }\) × 100 = \(\frac{30}{180 }\) × 100 = 16.67% = 16.7% (Correct to one decimal place) |