
In the species-area relationship equation, \( \log S = \log C+ Z \log A \), 'Z' denotes -
Answer & explanation
Correct answer: option 2
The correct answer is Option (2) → Regression coefficient
The species-area relationship says that species richness rises with the area explored, but only up to a limit. On a log scale it is a straight line. In this line, Z is the slope (the regression coefficient): it tells how fast species richness rises as the area grows. Z is about 0.1–0.2 for most areas, and 0.6–1.2 for very large areas such as whole continents.
Option (2) Regression coefficient — Correct. In the species-area relationship on a log scale, Z is the slope of the line, called the regression coefficient; C is the Y-intercept. Z usually lies between 0.1 and 0.2, whatever the taxonomic group or region.
Note: The same question was also asked in CUET (UG) 2025 on 29-05-2025 (Slot 1) and on 27-05-2025 (Slot 2), and a similar question in CUET (UG) 2026 on 30-05-2026 (Slot 2).
NCERT Extract:
Patterns of Biodiversity – “… (ii) Species-Area relationships : During his pioneering and extensive explorations in the wilderness of South American jungles, the great German naturalist and geographer Alexander von Humboldt observed that within a region species richness increased with increasing explored area, but only up to a limit. In fact, the relation between species richness and area for a wide variety of taxa (angiosperm plants, birds, bats, freshwater fishes) turns out to be a rectangular hyperbola (Figure13.2). On a logarithmic scale, the relationship is a straight line described by the equation
log S = log C + Z log A
where
S= Species richness A= Area
Z = slope of the line (regression coefficient)
C = Y-intercept
Ecologists have discovered that the value of Z lies in the range of 0.1 to 0.2, regardless of the taxonomic group or the region (whether it is the plants in Britain, birds in California or molluscs in New York state, the slopes of the regression line are amazingly similar).”
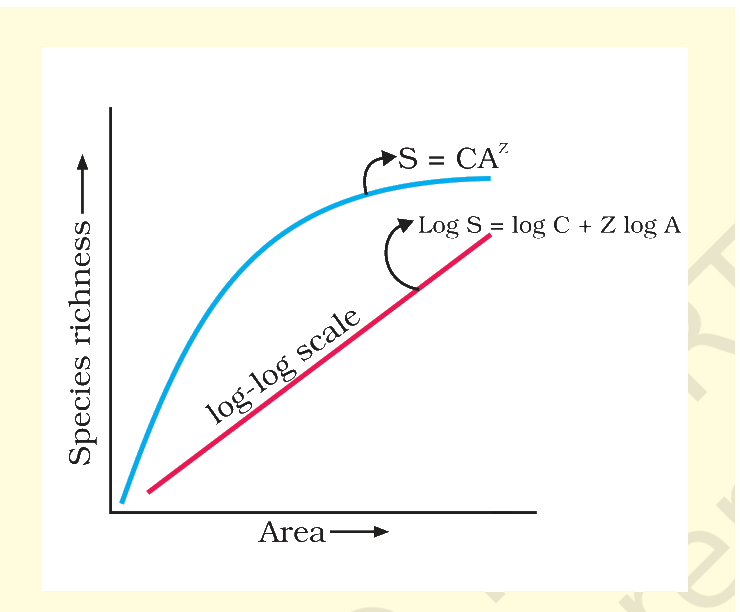
Figure 13.2 Showing species area relationship. Note that on log scale the relationship becomes linear