CUET Preparation Today
Study the given chart and answer the question.
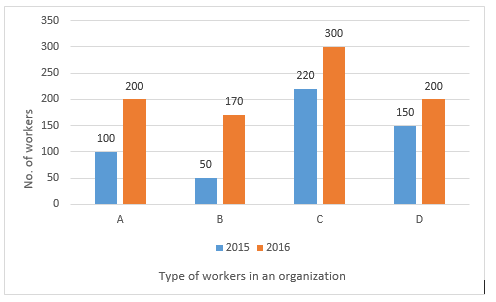
The percentage increase in the number of workers in 2016 is maximum as compared to that in 2015 in case of workers of type: |
C B D A |
B |
For A , Number of workers in 2015 = 100 Number of workers in 2016 = 200 Increased percentage in number of workers in 2016 comparative to 2015 = \(\frac{200-100}{100 }\) × 100 = \(\frac{100}{100 }\) × 100 = 100% For B, Number of workers in 2015 = 50 Number of workers in 2016 = 270 Increased percentage in number of workers in 2016 comparative to 2015 = \(\frac{270-50}{50 }\) × 100 = \(\frac{220}{50 }\) × 100 = 440% For C, Number of workers in 2015 = 220 Number of workers in 2016 = 300 Increased percentage in number of workers in 2016 comparative to 2015 = \(\frac{300-220}{220 }\) × 100 = \(\frac{80}{220 }\) × 100 = 36.36% For D, Number of workers in 2015 = 150 Number of workers in 2016 = 200 Increased percentage in number of workers in 2016 comparative to 2015 = \(\frac{200-150}{150 }\) × 100 = \(\frac{50}{150 }\) × 100 = 33.33% So , maximum percentage increase is for B. |