CUET Preparation Today
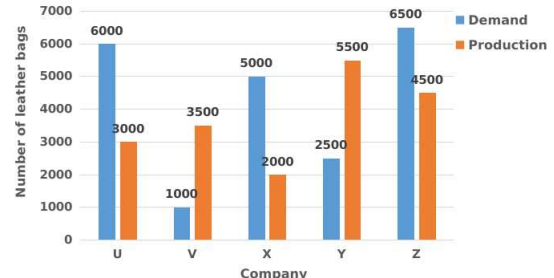
Study the given graph and answer the question that follows. The chart represents the demand and production of leather bags by five companies U, V, X, Y and Z.
The difference between the average demand and average production of the five companies taken together is: |
525 450 475 500 |
500 |
Average of production over all 5 companies = $\frac{Sum\;of\;production\;for\;5\;years}{5}$ = \(\frac{3000+3500+2000+5500+4500 }{5}\) = \(\frac{ 18500 }{5}\) = 3700 Average of demand over all 5 companies = $\frac{Sum\;of\;demand\;for\;5\;years}{5}$ = \(\frac{ 6000+1000+5000+2500+6500 }{5}\) = \(\frac{ 21000 }{5}\) = 4200 Difference in average production and average demand = 4200 - 3700 = 500 |