CUET Preparation Today
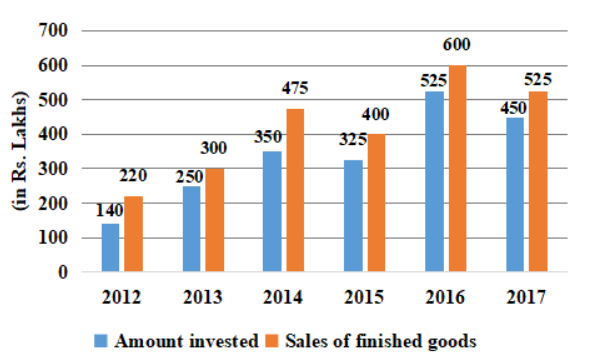
The following bar graph shows the amount(in Lakh Rs.) invested by a Company in purchasing raw material over the years and the values (in Lakh Rs.) of finished goods sold by the Company over the years.
The ratio of total amount invested for purchasing raw material from 2013 to 2015 to the total sales of finished goods in 2014, 2016 and 2017 is: |
27 : 56 56 : 27 64 : 37 37 : 64 |
37 : 64 |
Amount invested for purchasing raw material from 2013 to 2015 : Total sale of finished goods in 2014 , 2016 & 2017 ( 250 + 350 + 325 ) : ( 475 + 600 + 525 ) 925 : 1600 37 : 64 |