CUET Preparation Today
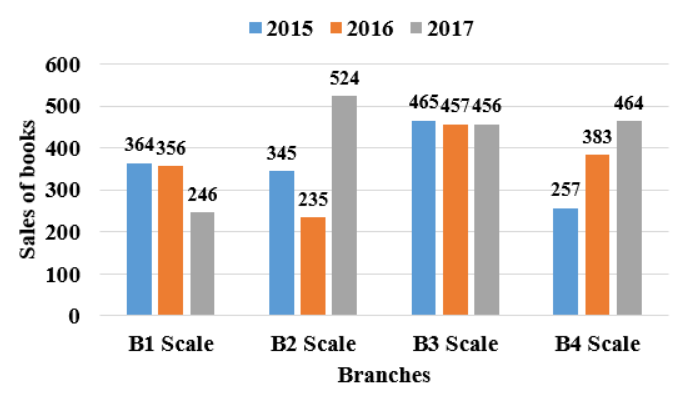
The following bar graph shows the number of books sold from four different branches, B1, B2, B3 and B4, of a publishing house, in three consecutive years.
Calculate the total number of books sold from branch B3 during these three years. |
1432 1783 1378 1322 |
1378 |
Total books sold from branch B3 = 465 + 457 + 456 = 1378 |