CUET Preparation Today
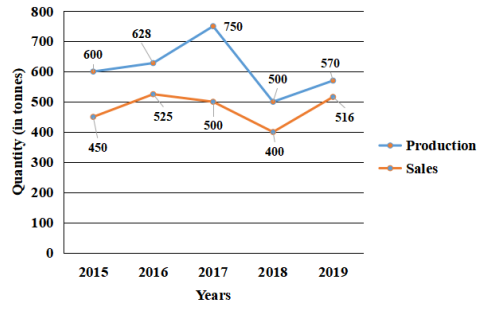
The line graph shows the production (in tonnes) and the sales (in tonnes) of a company.
What is the percentage of maximum increase or reduction in the production of the company in comparison to the previous year? |
46.67% reduction 33.33% reduction 50% increase 29% increase |
33.33% reduction |
In year 2016 , Percentage of increase in production in year 2016 compared to previous year = \(\frac{628-600 }{600}\) × 100 = \(\frac{28 }{600}\) × 100 = 4.67% In year 2017 , Percentage of increase in production in year 2017 compared to previous year = \(\frac{750-628 }{628}\) × 100 = \(\frac{122 }{628}\) × 100 = 19.42% In year 2018 , Percentage of decrease in production in year 2018 compared to previous year = \(\frac{750-500 }{750}\) × 100 = \(\frac{250 }{750}\) × 100 = 33.33% In year 2019 , Percentage of increase in production in year 2019 compared to previous year = \(\frac{570-500 }{500}\) × 100 = \(\frac{70 }{500}\) × 100 = 14% So , percentage of maximum increase or reduction in the production of the company in comparison to the previous year is 33.33% Ans :- 33.33% |