CUET Preparation Today
Given diagram is a Geometric Representation of Profit Maximisation (Short Run). Study the diagram given below and answer the question.
|
What is the total cost of the firm at $q_o$? |
OEB$q_o$ OpA$q_o$ the area of the rectangle EpAB None of the above |
OEB$q_o$ |
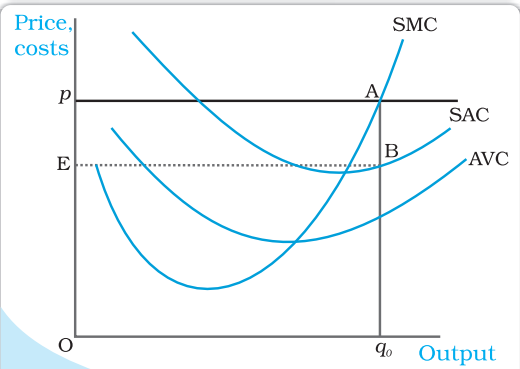
The correct answer is option 1: OEB$q_o$ The market price is p. Equating the market price with the (short run) marginal cost, we obtain the output level $q_o$ . At $q_o$ , observe that SMC slopes upwards and p exceeds AVC. Thus, the profit-maximising output level of the firm is $q_o$. The total revenue of the firm at $q_o$ is the area of rectangle OpA$q_o$ (the product of price and quantity) while the total cost at $q_o$ is the area of rectangle OEB$q_o$ (the product of short run average cost and quantity). So, at $q_o$ , the firm earns a profit equal to the area of the rectangle EpAB. |