CUET Preparation Today
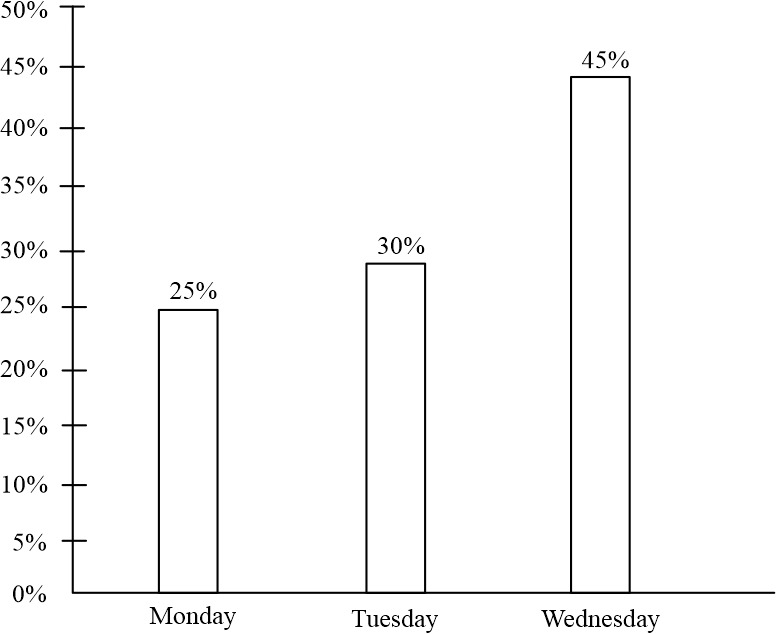
The below chart shows the percentagewise distribution of the number of people visits Museum in the respective days.
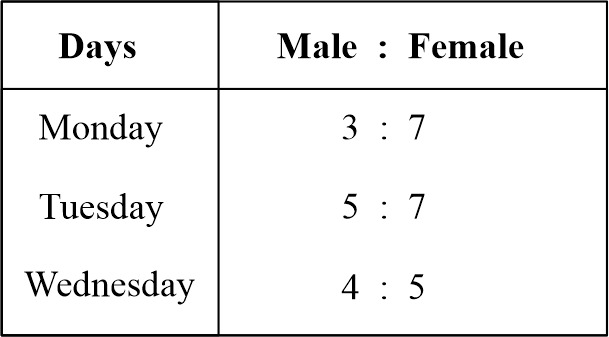
The total number of visitors = 400 The below tables shows the ratio of the number of male and female visitors in the respective days.
Find the number of male visitors on Wednesday is how much percent more or less then the number of female visitors on Monday. |
10% 12.5 % 16 \(\frac{2}{3}\) % 14 \(\frac{2}{7}\) % |
14 \(\frac{2}{7}\) % |
No. of visitors on Wednesday = 45% of 400 = 180 No. of male visitors on Wednesday = \(\frac{4}{9}\) × 180 = 80 No. of visitors on Monday = 25% of 400 = 100 No. of female visitors on Monday = \(\frac{7}{10}\) × 100 = 70 Difference = 80 - 70 = 10 Hence, Male visitors is = \(\frac{10}{70}\) × 100 % = 14 \(\frac{2}{7}\) % more then female visitors. |