CUET Preparation Today
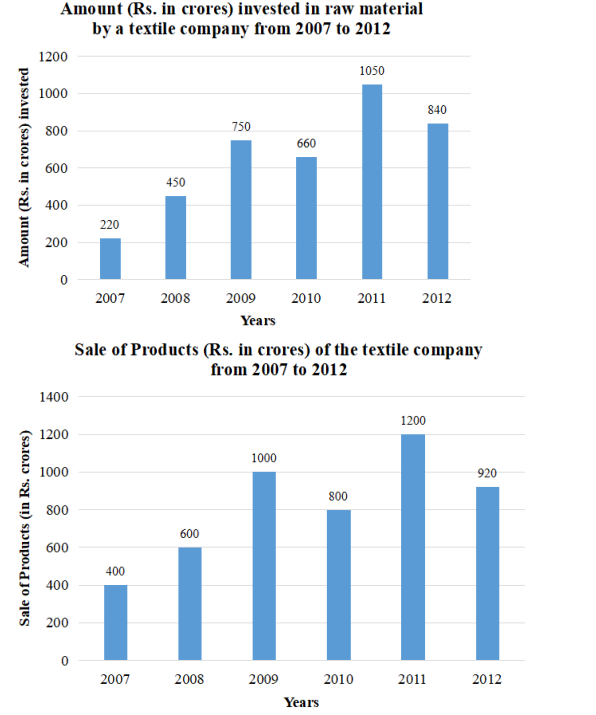
Study the given bar graphs and answer the question that follows. The bar graphs represent the amount invested in raw materials (in ₹ crore) and the sale of the products, by a textile company in the years 2007— 2012. The X-axis represents the years. The Y-axis represents the amount invested in raw materials (in ₹ crore) in figure 1 and sale of products in figure 2, respectively.
The sum of the amounts invested during the years 2007, 2008 and 2010 is what percentage (correct to one decimal place) of the sum of the sales of products during 2009 and 2011? |
60.4 61.4 61.5 60.5 |
60.5 |
Sum of the amounts invested during the years 2007, 2008 and 2010 = 220 + 450 + 660 = 1330 Sum of the sales of products during 2009 and 2011 = 1000 + 1200 = 2200 Required percentage = \(\frac{1330 }{2200}\) × 100 = 60.45% = 60.5% (correct to one decimal place) |