CUET Preparation Today
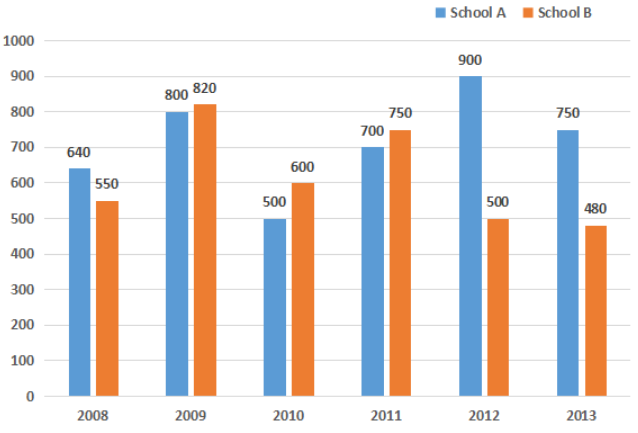
The given bar graph shows the number of students of two schools over a period of six years.
In the bar graph, what is the ratio of the average of the total students from school A to the average of the total students from school B? |
429 : 799 429 : 370 799 : 429 370 : 429 |
429 : 370 |
Total number of students of A = 640 + 800 + 500 + 700 + 900 + 750 = 4290 Average students of A = \(\frac{4290}{6}\) Total number of students of B = 550 + 820 + 600 + 750 + 500 + 480 = 3700 Average students of B = \(\frac{3700}{6}\) Average students of A : Average students of B \(\frac{4290}{6}\) : \(\frac{3700}{6}\) 429 : 370 |