CUET Preparation Today
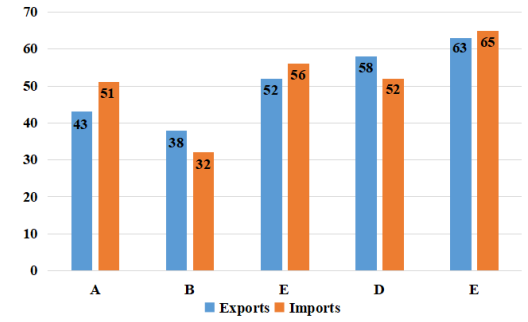
Study the given bar-graph and answer the question that follows. The given bar-graph shows the exports and imports (in crores of rupees) of five companies in a particular financial year.
Based on the given information, the ratio of exports to imports is highest in company _____ . |
A D B E |
B |
Lets solve one by one for each option . 1. A Ratio of Export to Import = \(\frac{43 }{51}\) = 0.84 2. D Ratio of Export to Import = \(\frac{58 }{52}\) = 1.11 3. B Ratio of Export to Import = \(\frac{38 }{32}\) = 1.18 4 . F Ratio of Export to Import = \(\frac{63 }{65}\) = 0.96 So , Highest ratio of export to import is of B.
|