CUET Preparation Today
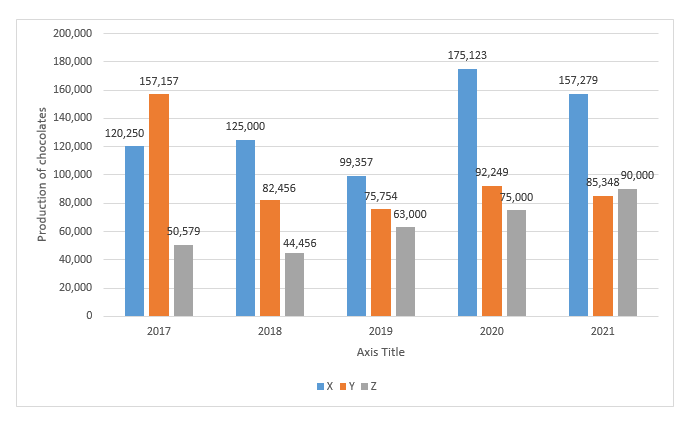
A Chocolate company prepares three different kids of chocolate - X, Y and Z. The production of X, Y and Z over a period of five years has been expressed in the bar graph. the total production of Z in 2017 and 2018 is what percentage of the total production of X in 2020 and 2021?
|
32.82% 86.67% 28.59% 45.68% |
28.59% |
Production of Z in 2017 & 2018 = 50579 + 44456 = 95035 Production of X in 2020 & 2021 = 175,123 + 157,279 = 332402 Required percentage = \(\frac{95035}{332402}\) × 100 = 28.59% |