CUET Preparation Today
Study the given graph carefully and answer the question that follows.
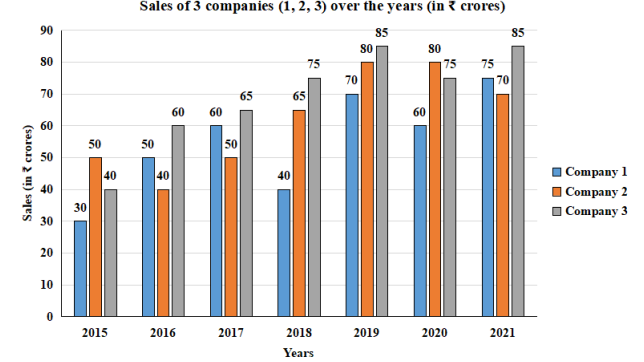
In which of the following years was the sales of company 1 exactly half of the total sales of companies 2 and 3 together in that year? |
2019 2021 2016 2020 |
2016 |
Lets solve one by one for each option. 1. 2019 Total sale of company 2 & 3 = 80 + 85 = 165 Sale of company 1 = 70 Percentage of sale of company 1 to company 2 & 3 together = \(\frac{70 }{165}\) × 100 = 42.42% ≠ 50% 2. 2021 Total sale of company 2 & 3 = 70 + 85 = 155 Sale of company 1 = 75 Percentage of sale of company 1 to company 2 & 3 together = \(\frac{75}{155}\) × 100 = 48.38% ≠ 50% 3. 2016 Total sale of company 2 & 3 = 40 + 60 = 100 Sale of company 1 = 50 Percentage of sale of company 1 to company 2 & 3 together = \(\frac{50 }{100}\) × 100 = 50% 4. 2020 Total sale of company 2 & 3 = 80 + 75 = 155 Sale of company 1 = 60 Percentage of sale of company 1 to company 2 & 3 together = \(\frac{60 }{155}\) × 100 = 38.70% ≠ 50% Ans :- 2016
|