CUET Preparation Today
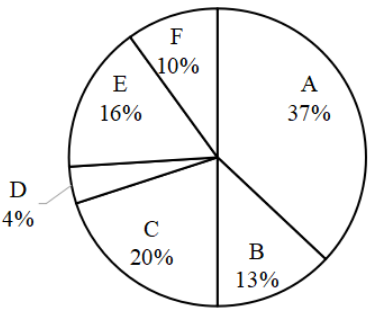
The pie chart given below shows the production of 6 different factories. The total production of all these 6 factories are 22000. The production of a particular factory is shown as a percent of total production of all these 6 factories.
P1 = The value of average production of A, C, D and F. P2 = The difference between the production of B and E. What is the value of (P1 + P2)? |
2525 6545 3525 4565 |
4565 |
Sum of production of A, C, D and F = (37% + 20% + 4% + 10%) of 22000 = \(\frac{71}{100}\) × 22000 = 15620 P1 = The value of average production of A, C, D and F. P1 = \(\frac{15620}{4}\) = 3905 Now , P2 = The difference between the production of B and E. = 16% of 22000 - 13% of 22000 = \(\frac{3}{100}\) × 22000 = 660 P1 + P2 = 3905 + 660 = 4565 |