CUET Preparation Today
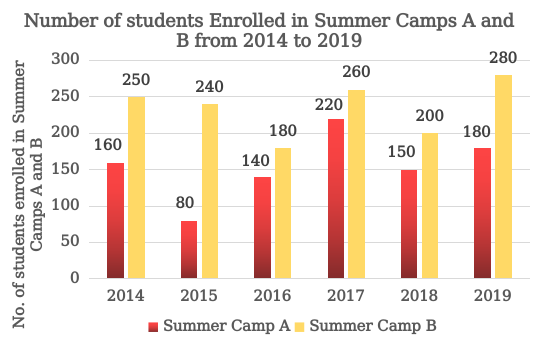
The following bar chart shows the number of students enrolled in two Summer Camps A and B from 2014 to 2019. Study the chart carefully and answer the question that follows.
The number of students enrolled in Camp A in 2016 and 2019 together is what percentage of the number of students enrolled in Camp B in 2015 and 2017 together? |
64% 75% 60% 80% |
64% |
Number of students in Camp A in 2016 and 2019 = 140 + 180 = 320 Number of students in Camp B in 2015 and 2017 = 240 + 260 = 500 Required percentage = \(\frac{320}{500}\) × 100 = 64% |